KS1 – Maths challenges
Happy Thursday!
This weeks Maths challenges are going to be around creating pictograms and bar graphs.
Can you create a pictogram or bar graph about the number of cars or vans that you see on the road over 15 minutes?
Choose a time of day when you have 15 spare minutes to go outside and count the traffic. You must stay in the same spot. Before you go out choose 4 or 5 vehicles you are going to look for e.g. cars, lorry, emergency vehicles, buses.
You will need to create a table like the one below before you go out. For each mode of transport that you see, draw a stick. Year 2’s, don’t forget to close the gate when you get a multiple of 5.
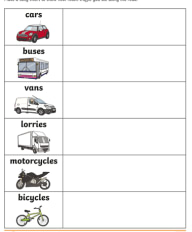
Once you have your table it time to head outside.
When you have completed your table, watch one of the powerpoints to help you create take the data from your chart and put it into a graph.
Year 1 – Pictograms Pictograms
Year 1 & 2 – Scaled Pictograms Scaled pictograms
Year 2 – Block graph Block graph
It is now time to create your graph. I wonder which was the most popular mode of transport you saw?
Challenge:
I wonder if you can answer questions about different graphs? Click on the link below and see if you can.
Interpreting pictograms
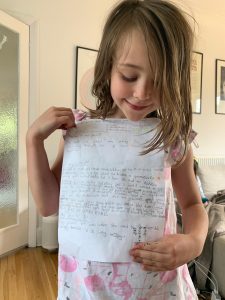
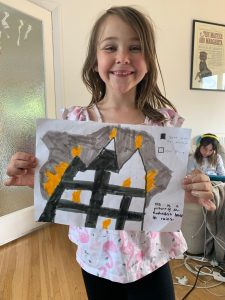
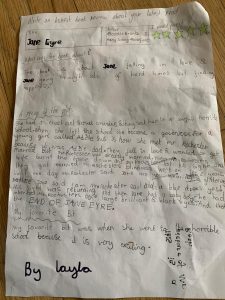
Remember to send in you amazing work to us, just like Layla has done.
She has written a book review and a drawing of a book she has recently read.
Key Stage 1 team x